Professional Work

What I build and deliver

Planning practice, spatial analysis, and civic technology.

My professional work combines planning analysis with digital and spatial tools. This page highlights selected planning books and interactive civic applications developed through undergraduate and graduate projects.

Comprehensive Planning · Climate · Transit Analytics · Civic Technology

Long-form planning documents, start to finish

Selected planning books developed through undergraduate and graduate planning work, integrating spatial analysis, policy analysis, planning strategy, and visual communication.

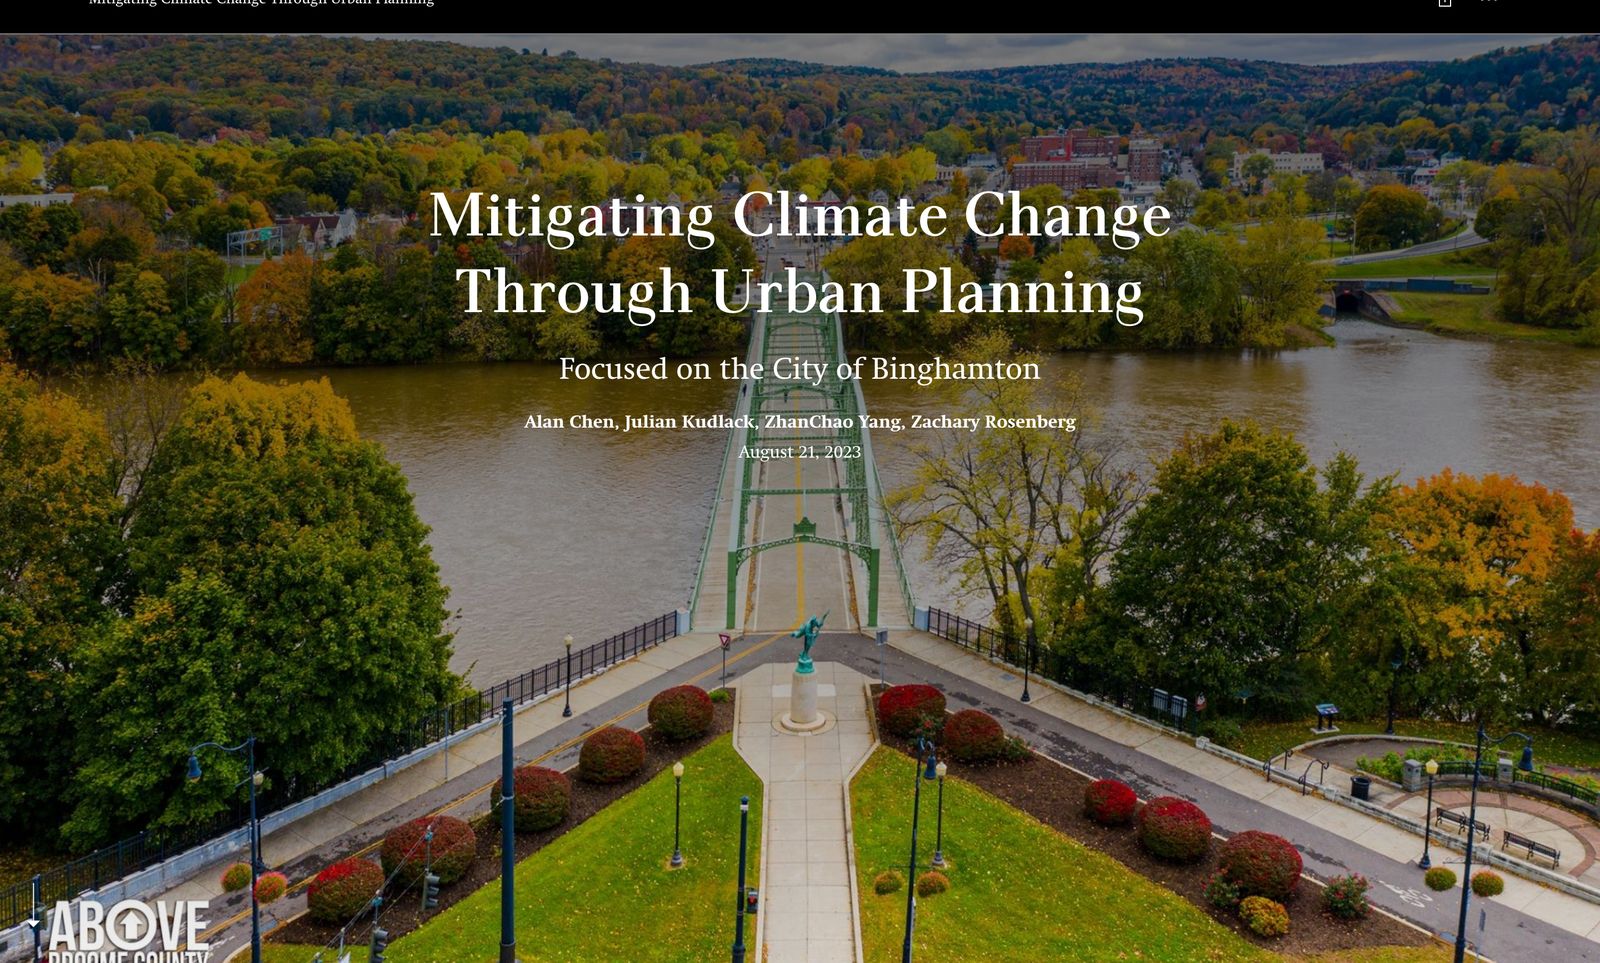
ArcGIS StoryMap Opening panel of the Mitigating Climate Change Through Urban Planning StoryMap, showing an aerial view of the pedestrian bridge over the Susquehanna River in Binghamton, New York.

Binghamton University · ENVI 415 · 2023

Mitigating Climate Change Through Urban Planning

Focused on the City of Binghamton

An undergraduate climate action plan for a small post-industrial city in New York's Southern Tier. The plan sets out the need for municipal climate action, builds a baseline from local emissions and land use data, weighs alternatives against explicit evaluation criteria, and recommends mitigation measures the city can realistically carry.

My role: project manager — ran the team and the schedule, set the planning strategy, wrote most of the plan, and presented it.
Climate Mitigation GIS Spatial Analysis Community Planning
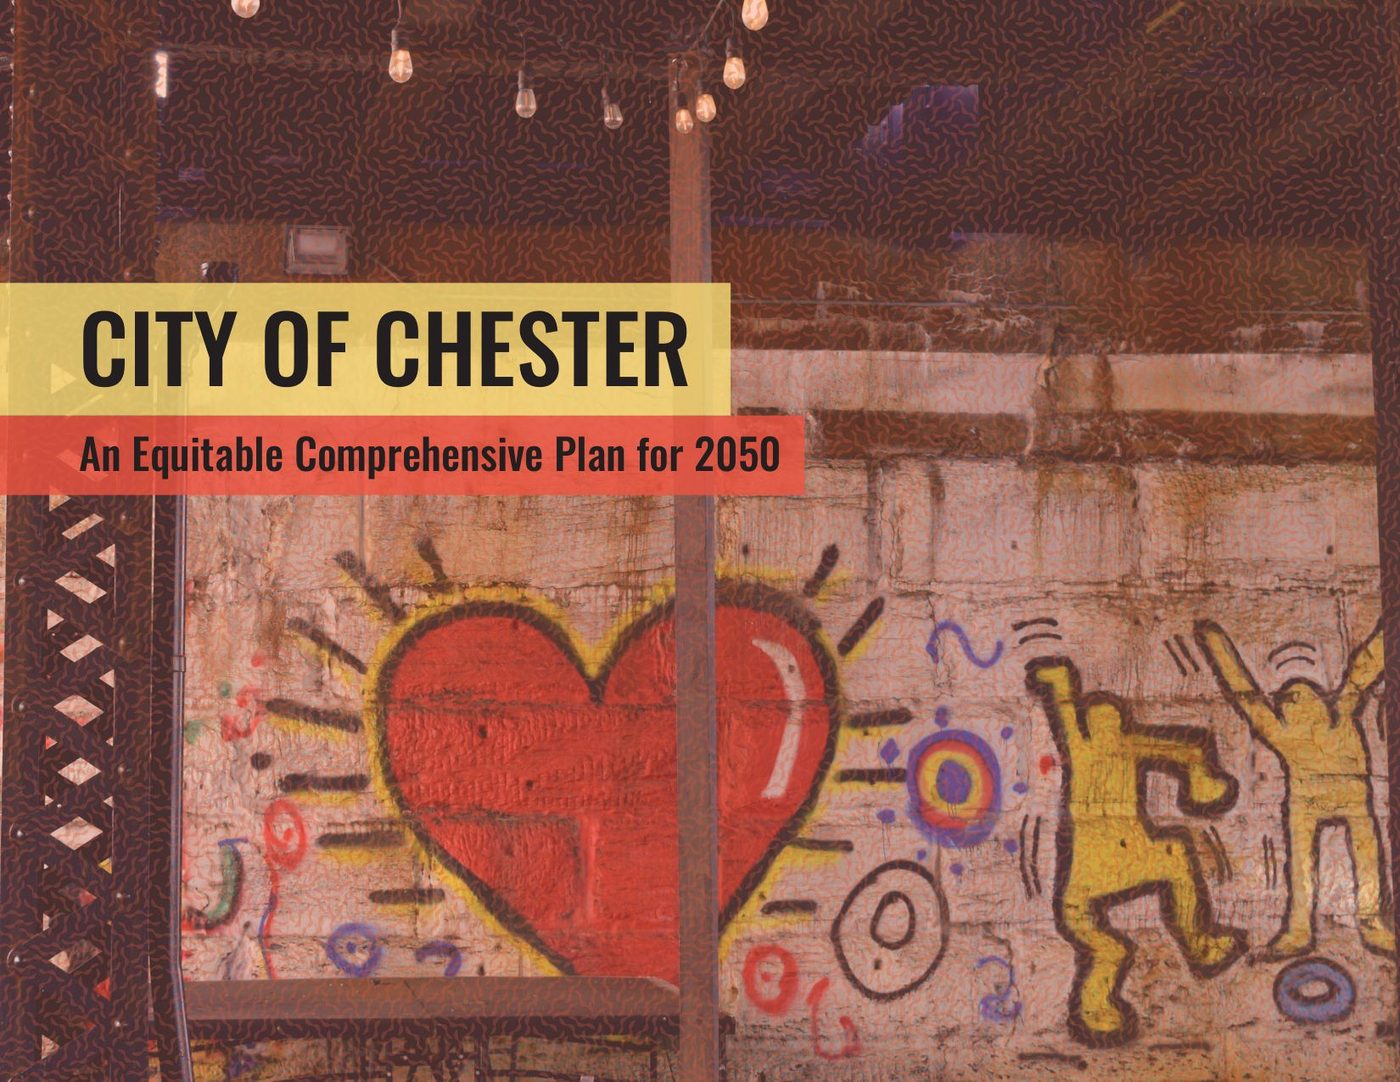
51-page book · PDF Cover of City of Chester: An Equitable Comprehensive Plan for 2050, showing a mural of a heart and dancing figures painted on a Chester wall.

Penn Weitzman · Planning Studio · 2025

City of Chester

An Equitable Comprehensive Plan for 2050

A graduate studio comprehensive plan for Chester, Pennsylvania, a waterfront city working through municipal bankruptcy and decades of disinvestment. Equitable Chester 2050 invests in the city's fiscal capacity, infrastructure, neighborhoods, and people, and was developed with the City's Planning & Zoning Director and Chester community groups.

My role: transportation analyst — network and transit analysis, mobility recommendations, and presenting the studio's work.

Comprehensive Planning Transportation Equity Planning Strategy
Read the Planning Book PDF · 51 pages · 14 MB

Prototypes that put planning data in front of people

Interactive prototypes exploring how data, digital interfaces, and civic technology can support planning analysis, public engagement, and communication. Each one runs live in the browser.

zhanchaoyang.com/transit-index-dashboard
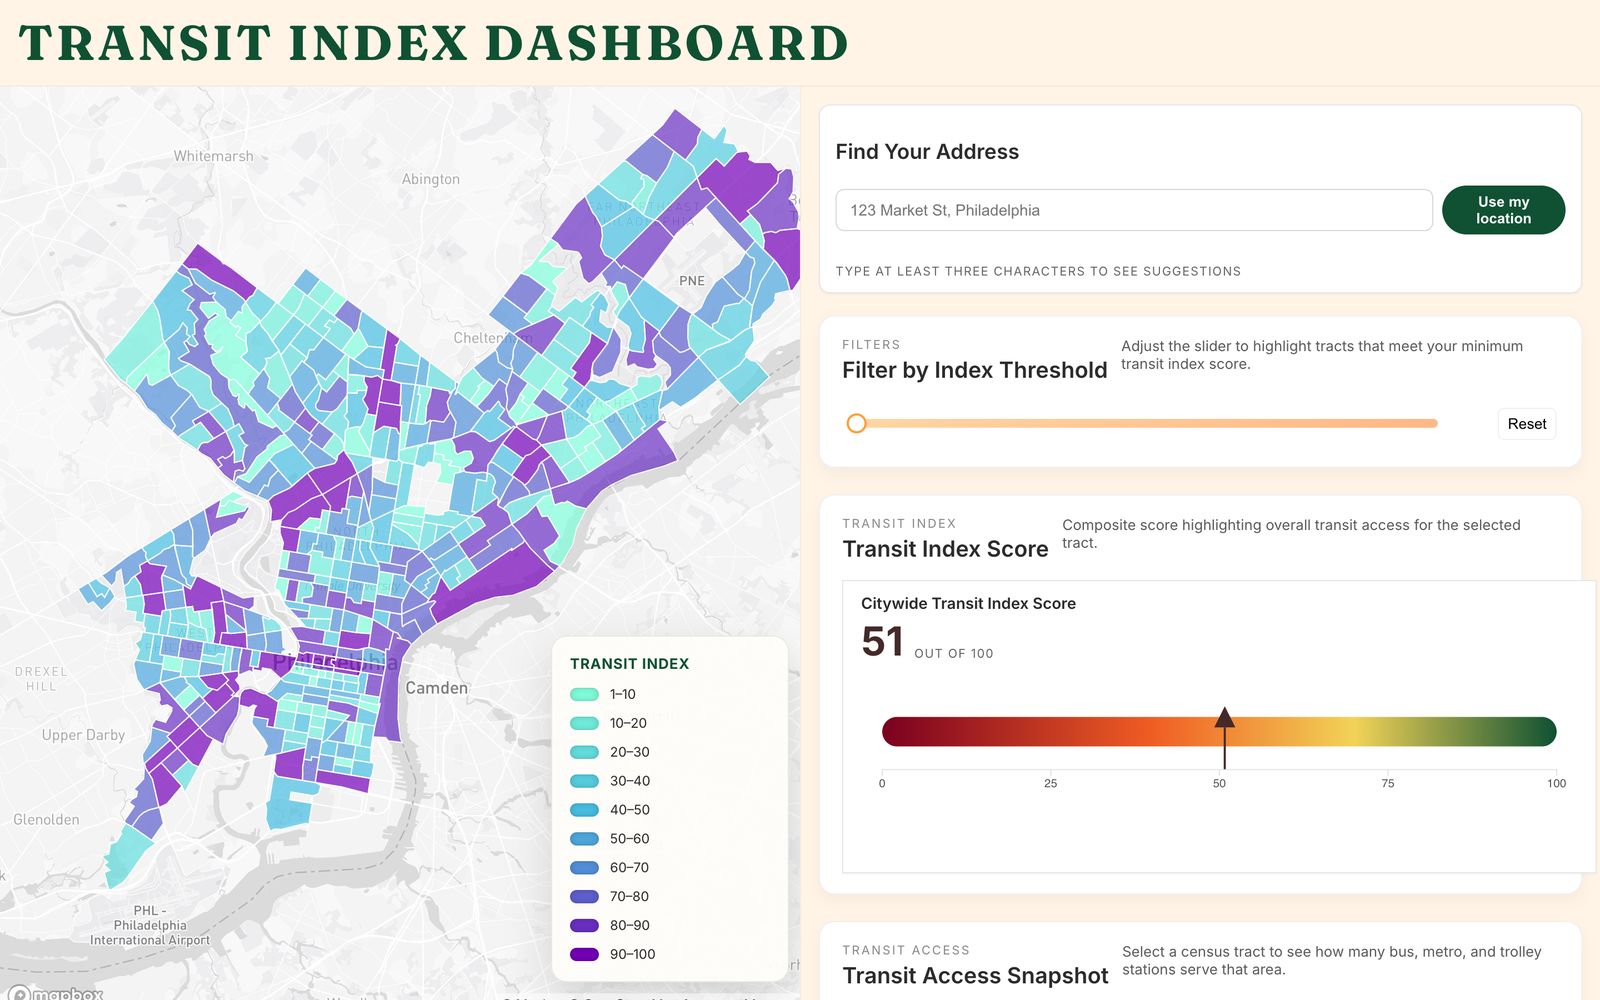
Transit Index Dashboard showing a choropleth map of Philadelphia census tracts beside an address search, an index threshold filter, and a citywide transit index score of 51.

Planning Analytics / Dashboard

Transit Index Dashboard

A public-facing tool that turns Philadelphia's transit network into a single, legible score. Housing seekers and tenants can search an address and see how well any census tract is served by subway, bus, trolley, and regional rail.

  • Address search and geolocation down to the census tract
  • Composite transit index scored 0–100, with methodology published
  • Threshold slider that filters the map to tracts meeting a minimum score
  • Station-level access snapshot for the selected tract
JavaScriptMapbox GLCensus DataGTFS

Launch demo

musa-zhanchao.github.io/engagement-tools-js
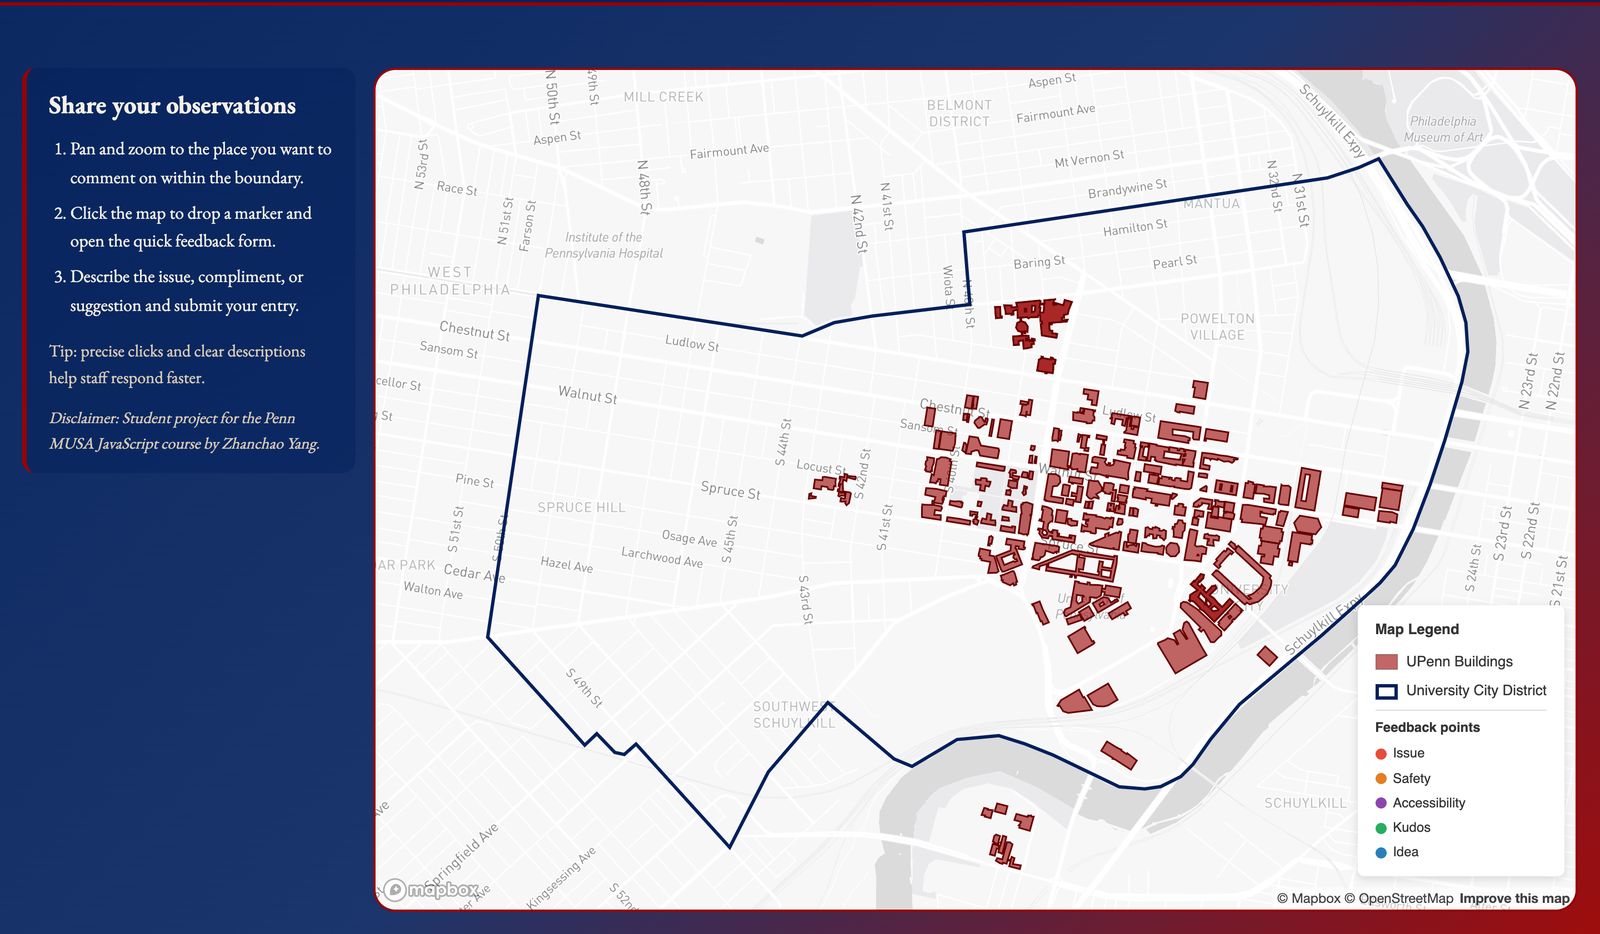
Anchor Institution Engagement Tool showing a map of the University City District boundary and Penn buildings beside instructions for dropping a feedback marker.

Civic Technology / Community Engagement

Anchor Institution Engagement Tool Archived

A map-first feedback tool for the campus edge, where a university and its neighbors share the same streets. Students, staff, and residents drop a pin on a specific place and say what works, what is broken, or what could be better.

  • Click-to-place markers bounded to the University City District
  • Short structured form: issue, safety, accessibility, kudos, idea
  • Participation guidelines and consent gate before any submission
  • Submissions organized for facilities and district staff to act on
JavaScriptMapbox GLPenn MUSA

Launch demo

weitzman-musa-geocloud.github.io/s26-team4-cama
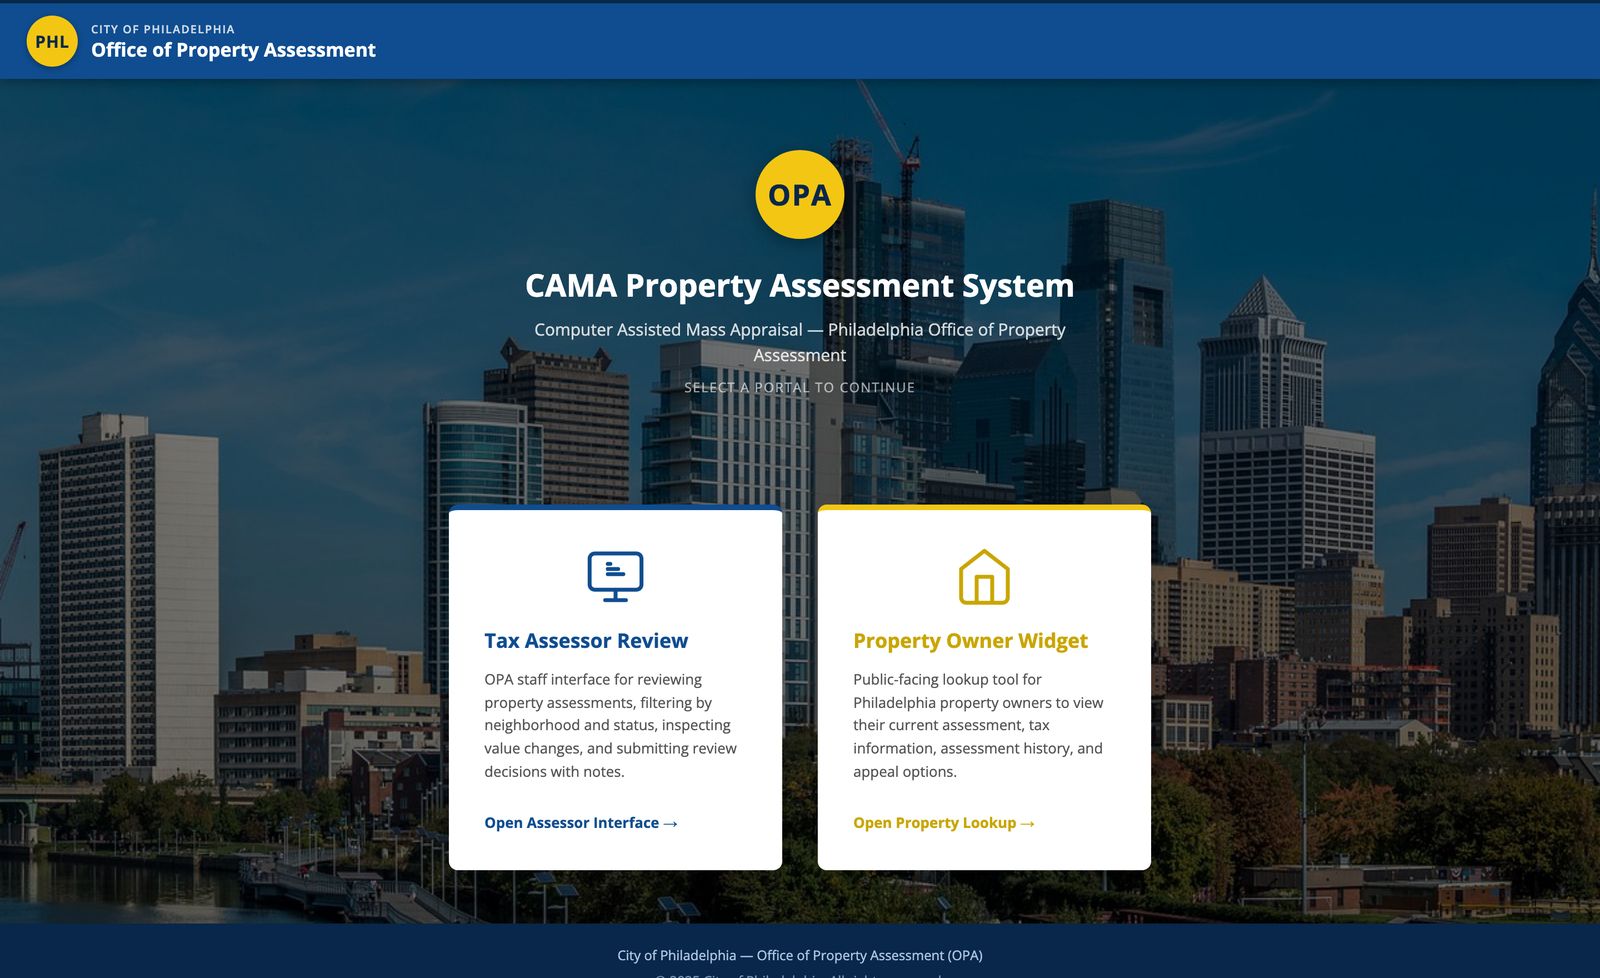
CAMA Property Assessment System landing page offering two portals: a Tax Assessor Review interface for OPA staff and a public Property Owner Widget.

Civic Information / Team Dashboard

CAMA Property Assessment System

A two-sided prototype for Philadelphia's Office of Property Assessment: one interface for the staff who review computer assisted mass appraisal output, another for the property owners on the receiving end of it. Same data, two very different jobs to do.

  • Assessor portal: filter by neighborhood and review status
  • Inspect value changes and record review decisions with notes
  • Owner portal: look up a property's current assessment and history
  • Plain-language tax information and appeal options
Web AppPhiladelphia OPATeam Project

Launch demo

musa-zhanchao.github.io/mexico-city-metro-storymap
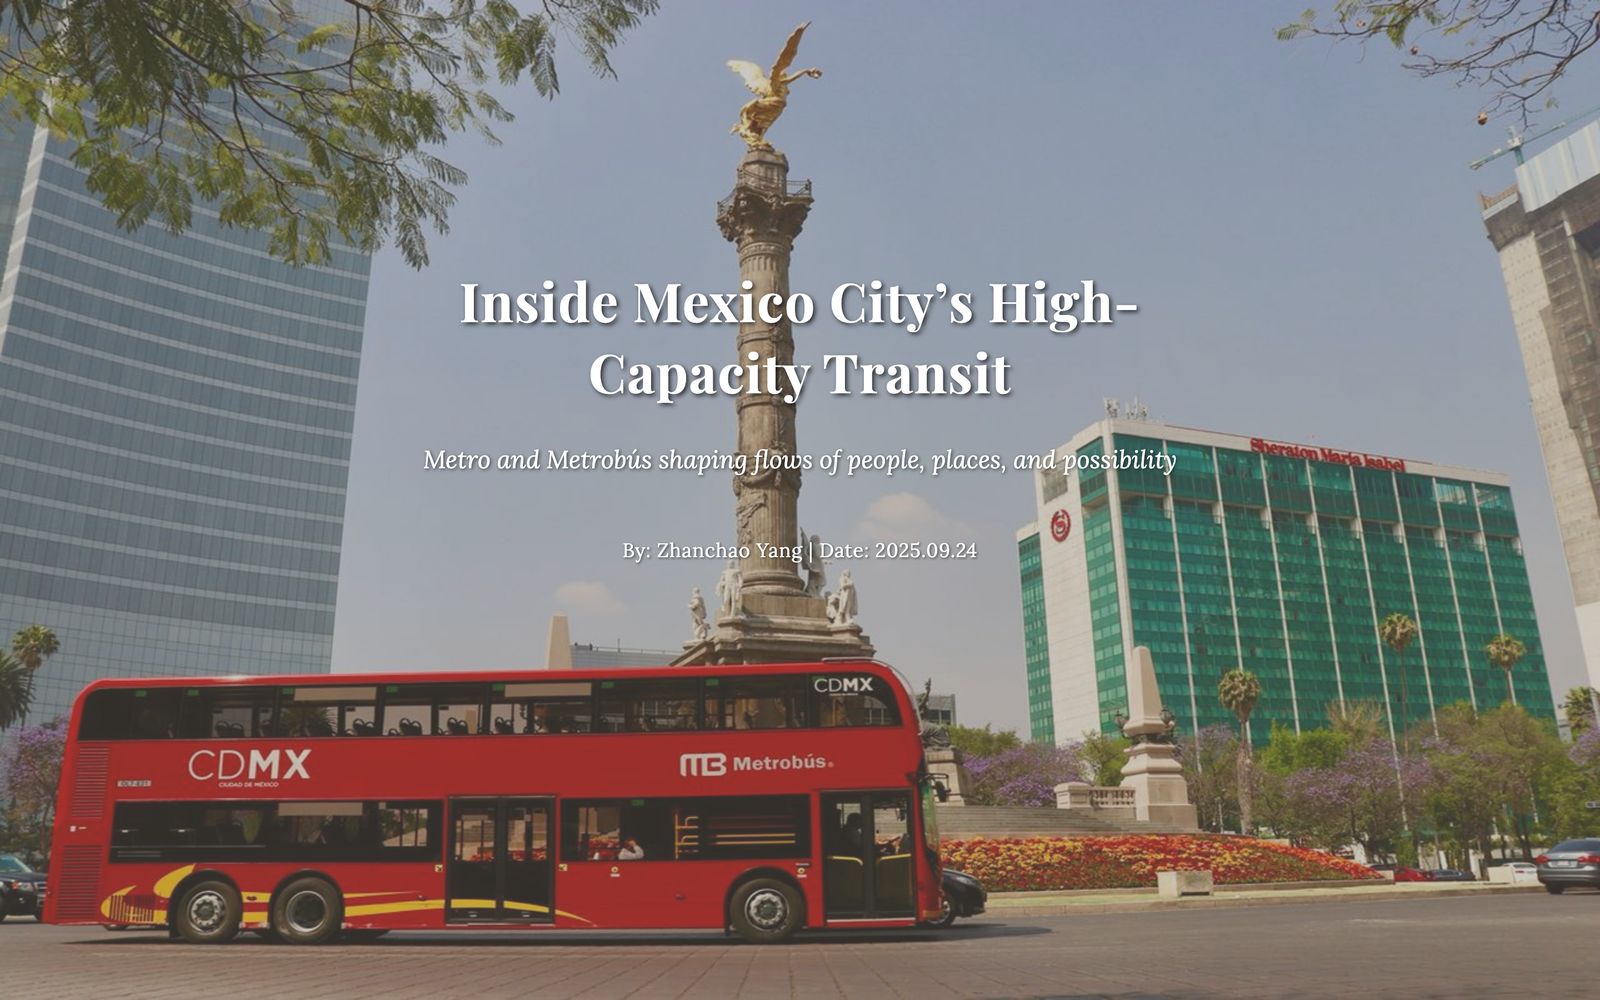
Opening panel of the Mexico City transit storymap, showing a red Metrobús passing the Angel of Independence monument in Mexico City.

Data Storytelling / Transit Communication

Inside Mexico City's High-Capacity Transit

A scrolling map narrative on the Metro and Metrobús: how a rubber-tired subway opened in 1969 and a center-running busway opened in 2005 came to carry a metropolis, and what riders actually experience on them today.

  • Scroll-linked map that flies between corridors and stations
  • Chapters on origins, expansion, upgrades, and rider experience
  • Network geography read alongside crowding and safety
  • Written for a general audience, not a technical one
JavaScriptLeafletMapboxScrollytelling

Launch demo

This page stays selective. If you are looking for the questions behind the work rather than the deliverables, the research is next door.

See the research →